Emotion-Grid
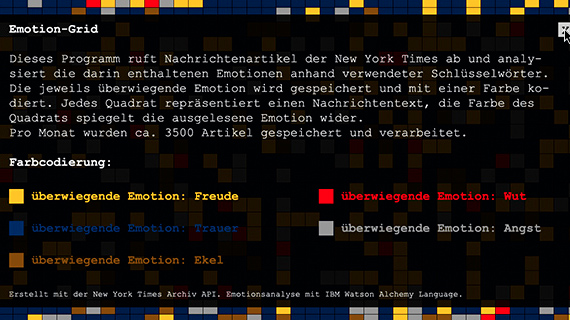
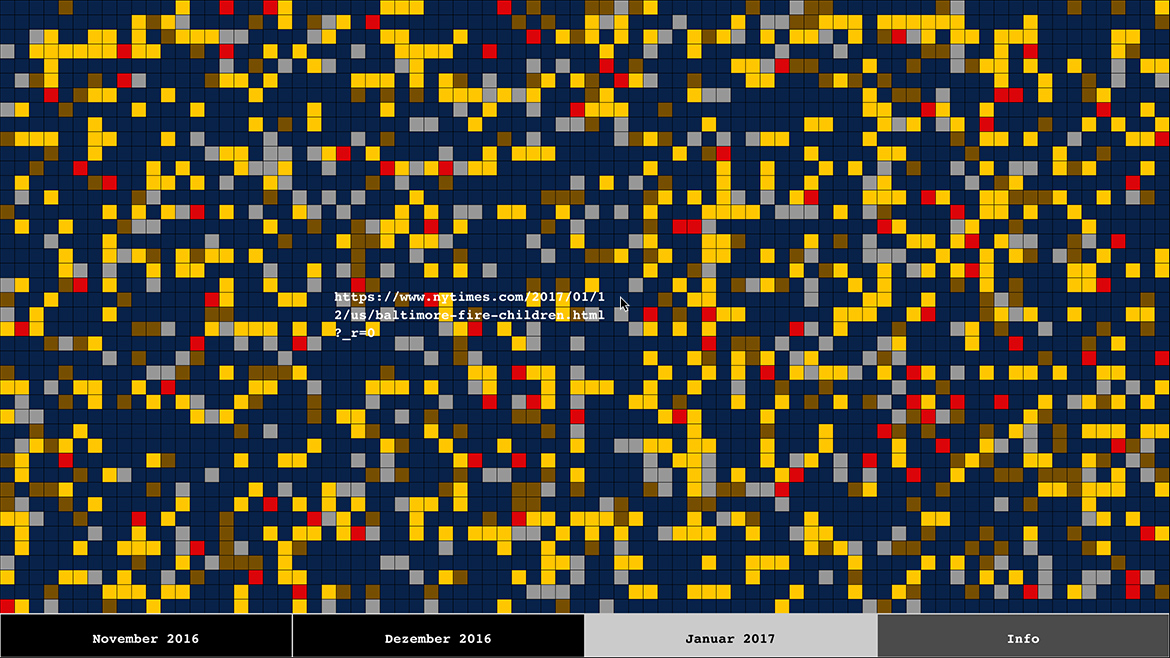
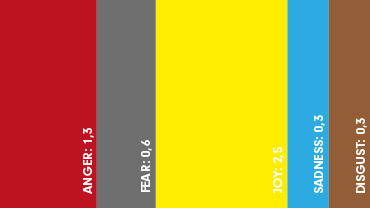
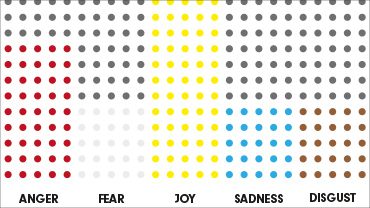
Emotion-Grid is a software application I developed for my interactive design class in university. The script saves news articles from the New York Times and analyses the emotions contained in the article using IBM Watson's AlchemyLanguage API. Watson can detect five different emotions in each text: joy, sadness, disgust, anger and fear. My script then defines the strongest emotion determining the overall sentiment of each article.
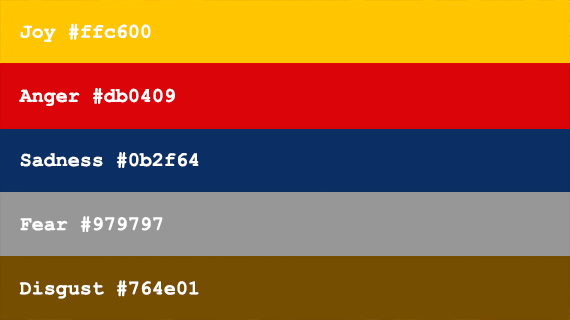
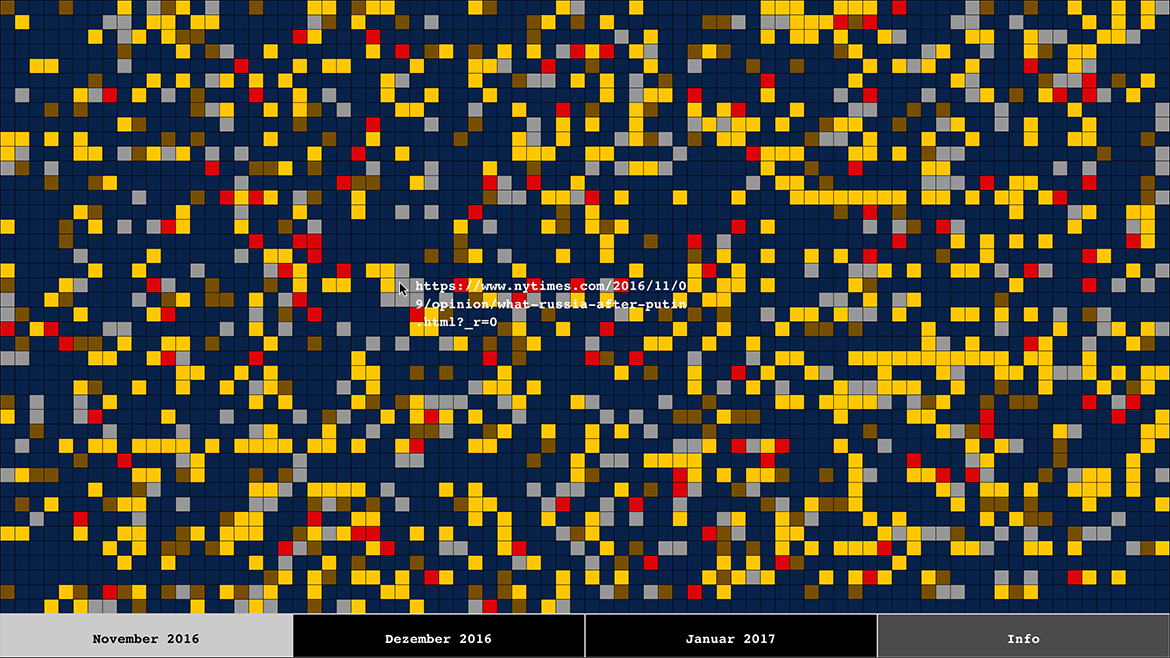
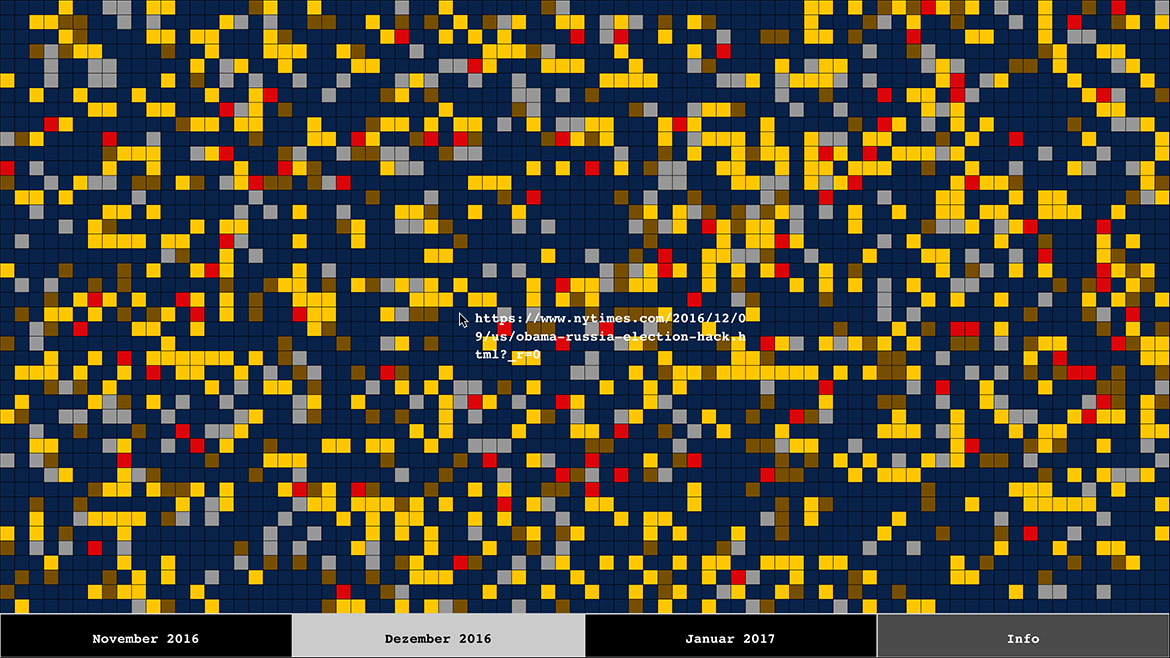
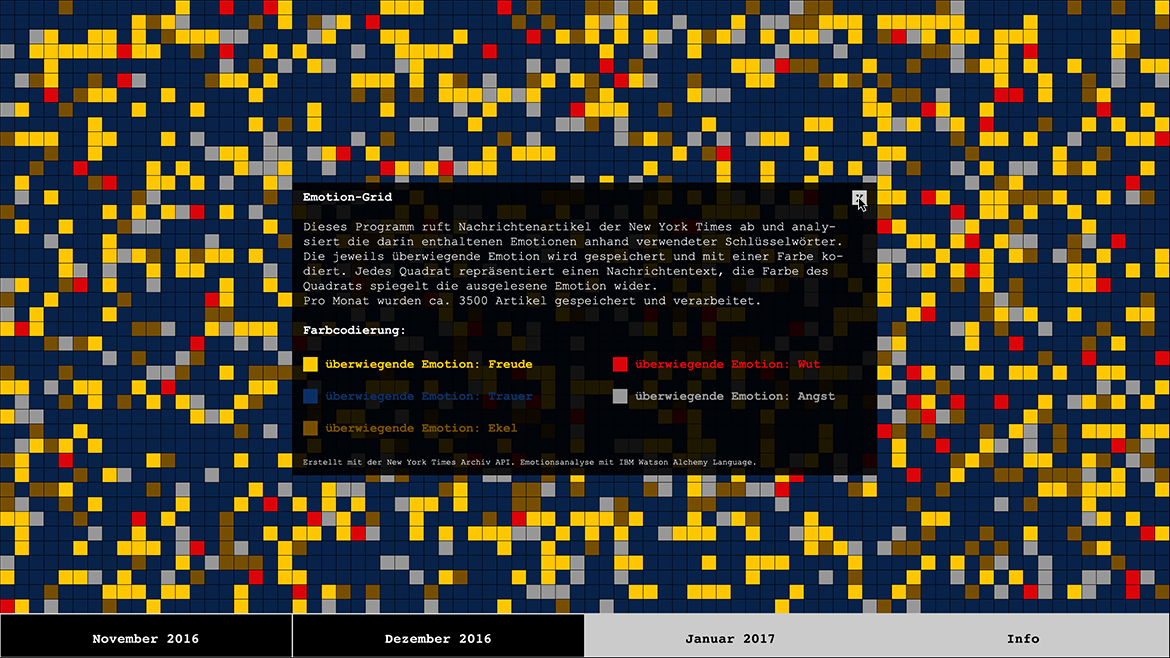
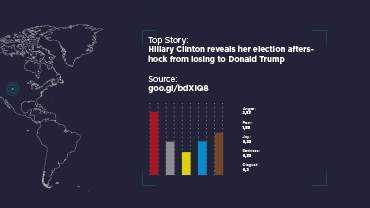
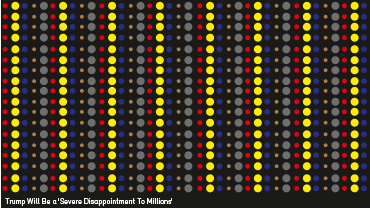
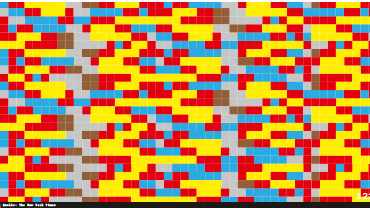
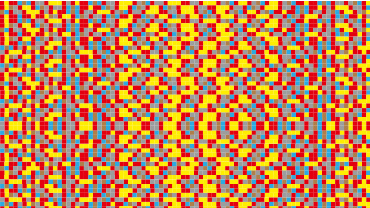
To visualize the output, a square gets drawn for every analysed article. I defined a color for every above-mentioned emotion – the strongest emotion (overall sentiment) defines the square's colour. This results in a grid showing the overall emotions from almost 3500 NYT articles per month.
An abstract piece of art which reveals its meaning only by looking closer and moving the cursor over the grid.
Written in Processing with the New York Times Archive API and IBM Watson AlchemyLanguage.
Year / 2016
Client / work for university
Role / Art Direction, Creative Coding
Process:
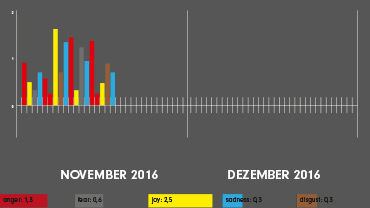
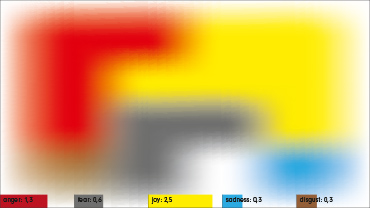
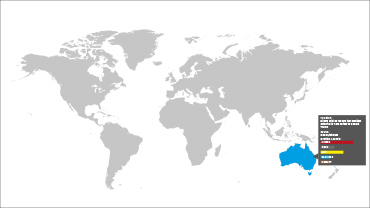
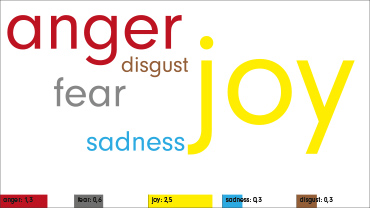
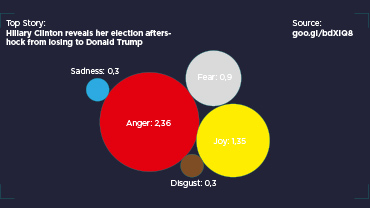
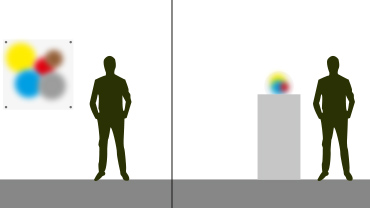
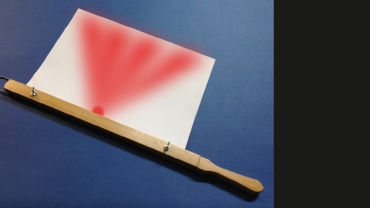
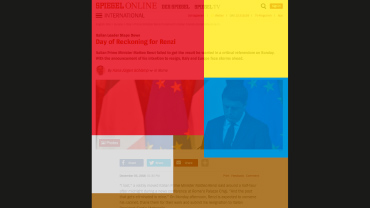
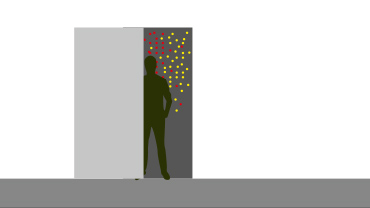
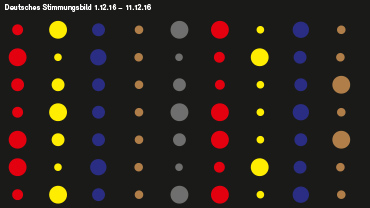
After settling on the use of the two APIs, I had the chance to make some experiments. My goal was to find the ultimate way to display this kind of data. I created concepts in various directions, including physical objects like lamps or even walkable installations.
In the end I chose the grid: I loved the fact that displaying this kind of data in an abstract way makes it hard to tell what you're seeing at first glance, revealing the full meaning only by looking closer. The grid also allowed me to display a huge amount of data, making it comparable throughout the months.


















Colours & Typography:
Regarding the colours, I decided to keep it simple and chose colours representing the emotion in the best possible way. The buttons are dark gray to make sure the viewer doesn't get too distracted from the squares. Every text is written in Courier New as it can be associated with the style of a news ticker.
